It seems like every week a new opinion piece is published about the potentially disastrous effects of cutting the budget for scientific research. Most scientists, myself included, have stories of friends who left academic research discouraged by the budget situation or know of established labs that have had to lay off technicians or postdocs after losing funding. Even the NIH Director Francis Collins is singing the blues. But the government invests billions of dollars in research funding every year, so can the state of science funding in the US really be that bad? After looking at the evidence, I am convinced that yes, it really is that bad and that we as scientists need to do a better job of communicating to our elected officials and the public the value of investing in science.
How Has Science Funding Changed Over Time?
The NIH budget was doubled over a 5 year period (1998-2003), and since then funding has remained flat in real dollars but decreased by ~20% if you account for biomedical inflation. NSF Funding since 2003 has shown a similar trend (1). NIH’s FY 2014 Budget is $30.15 B, an increase of $1B over the first year of the sequester (FY 2013), but still lower than the FY 2009 budget. Together, NIH and NSF receive ~$37B in funding or less than 2% of the federal budget.

What Do We Get For Our Investment in Science Research?
The list of advances that have been at least partially funded by federal money is too long to list here. Federally funded research has laid the groundwork for advances in medical treatments (polio vaccine, chemotherapy, antiretroviral AIDS drugs; 2) and the development of technologies that we take for granted (Google search engine, GPS, solar panels 3). If you were offered the opportunity to buy a stock with the return on investment that federal science funding generates you would be a fool not to buy it. It is estimated that every $1 invested in the NIH generates $2.21 in economic activity (and here in CA that number is estimated to be $2.40; 4). Similarly, every $1 invested in NSF is estimated to generate $2 in economic activity (5). NIH and NSF also support students and trainees at all levels, including the MARC, RISE, LSAMP and RUMBA programs here at SJSU.
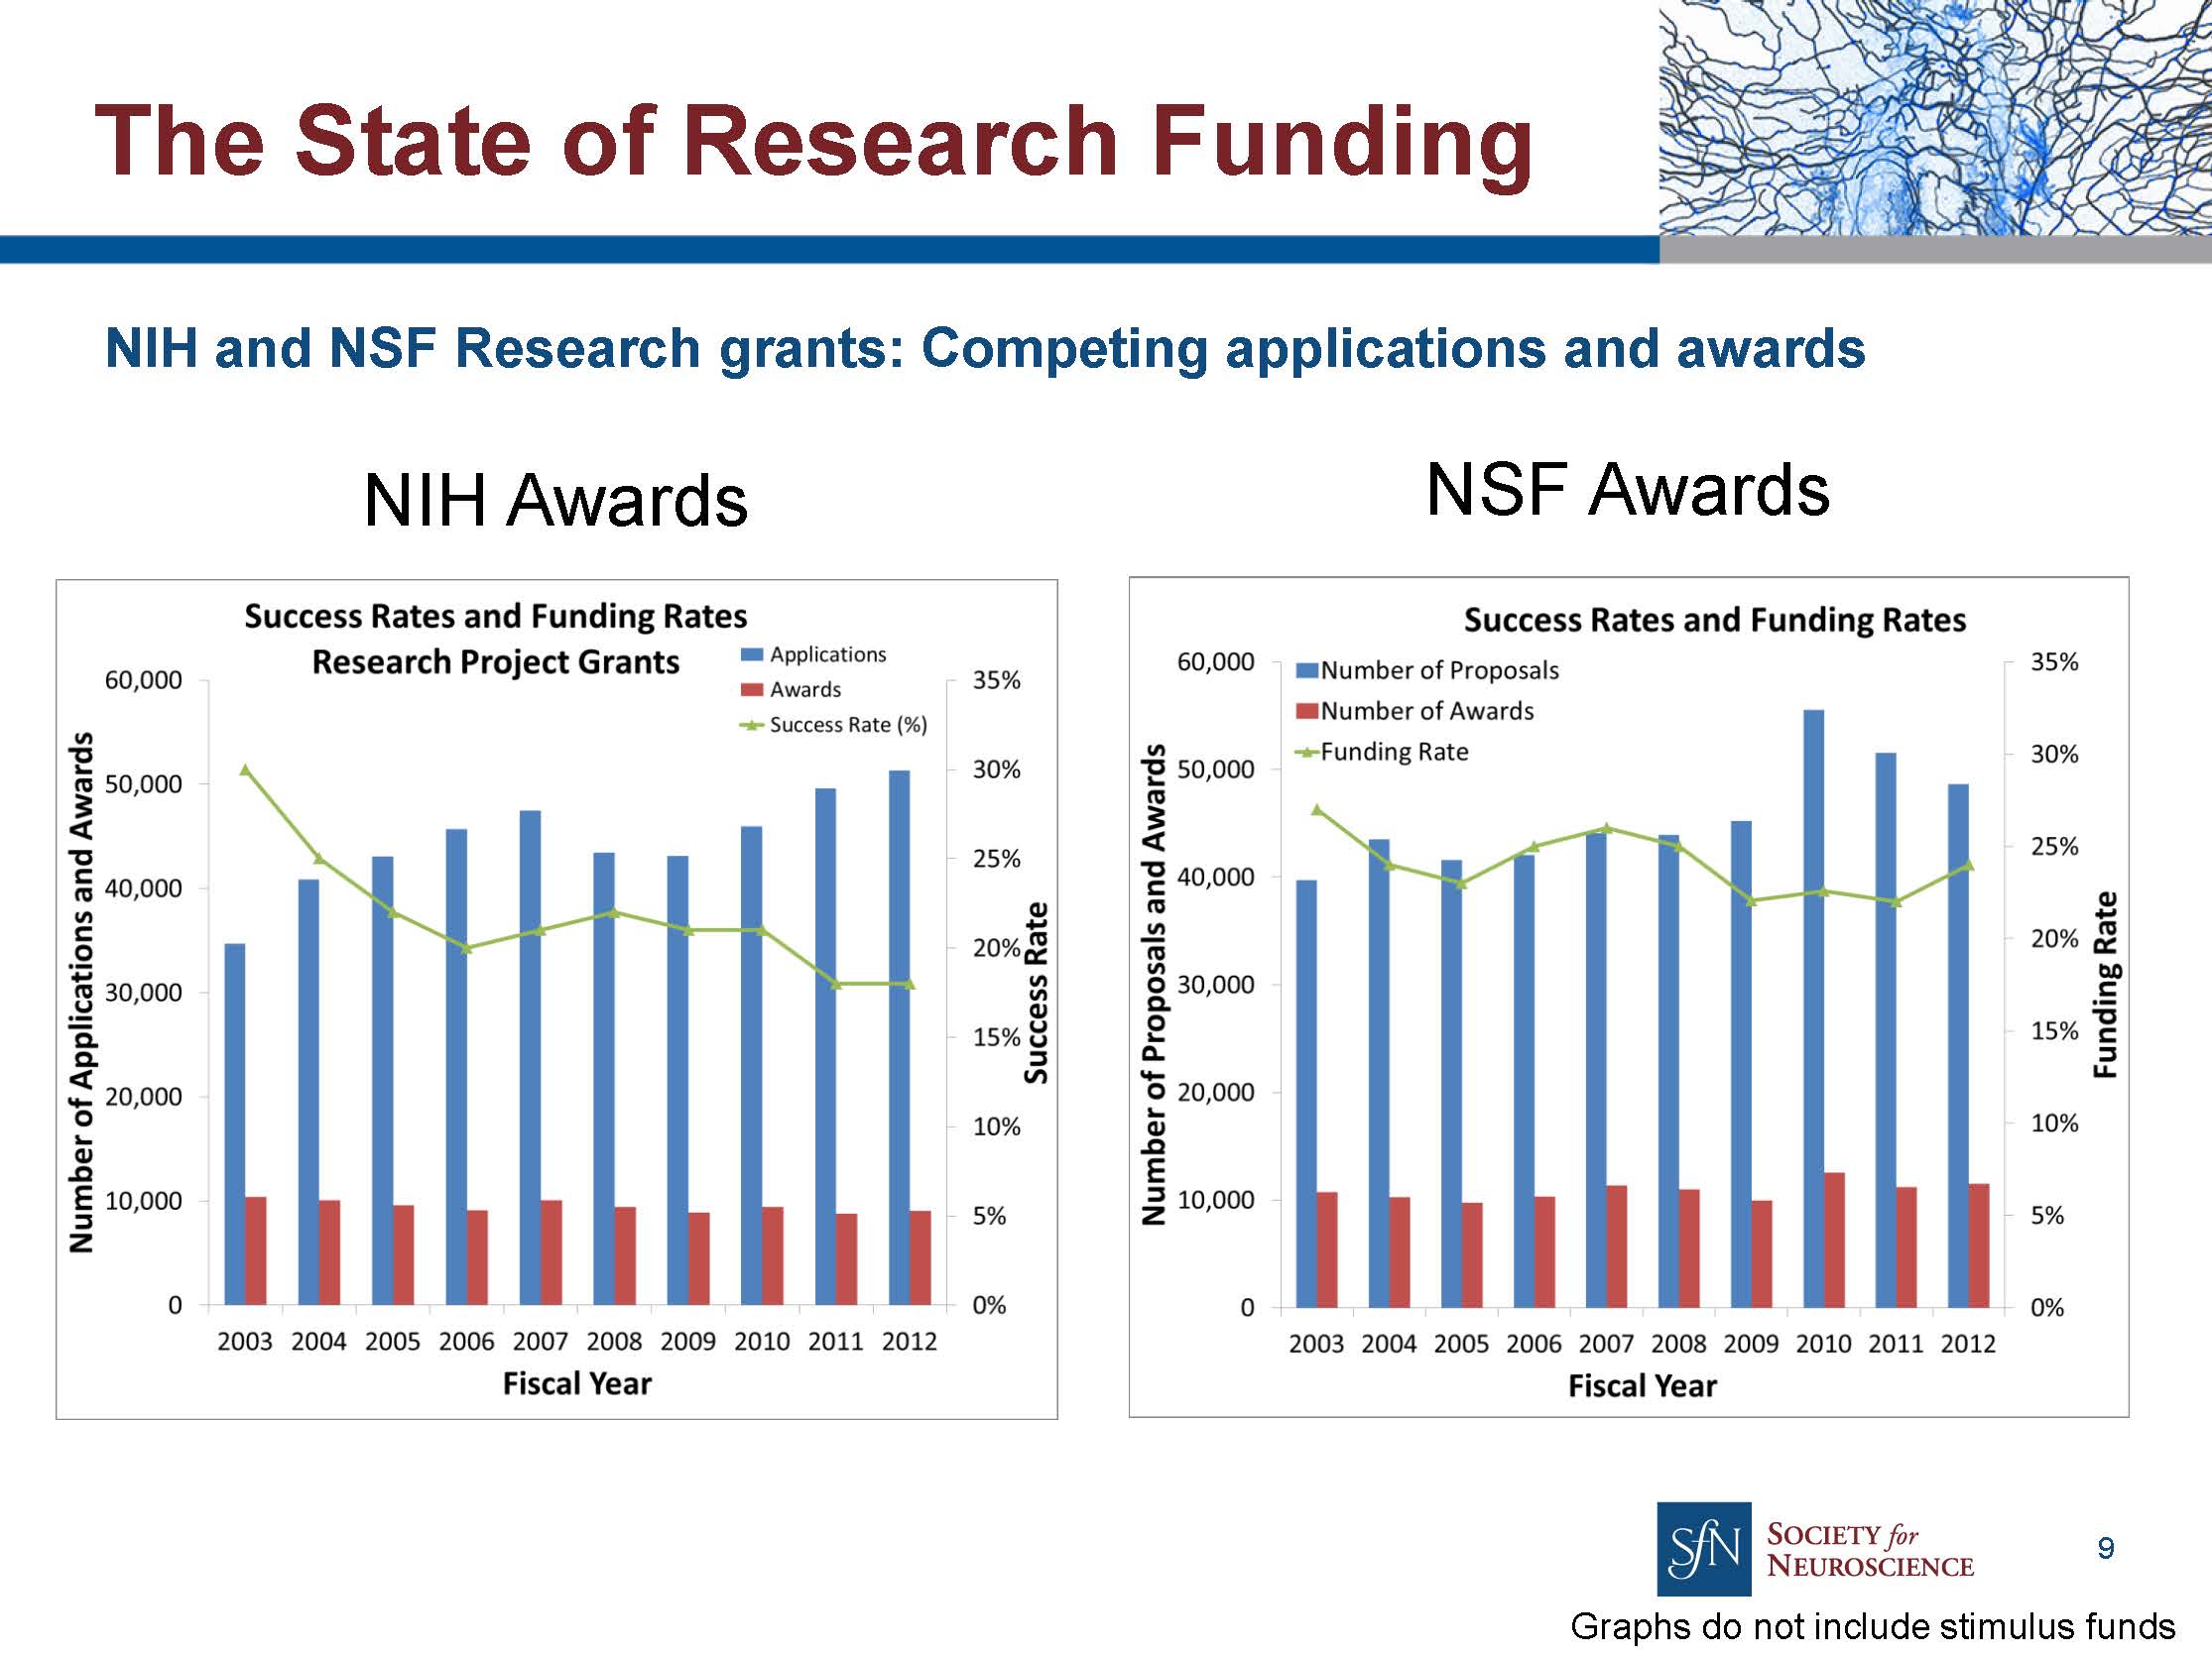
How Have Grant Success Rates Changed Over Time?
As funding levels and the number of awards have remained flat since 2003 and the number of applications has increased, the percentage of grants funded have decreased. Success rates for NIH R01 grants have plummeted from ~30% in 2003 to the historic low level of 17.5% in 2013 (1, 6). Success rates for first time applicants to NSF fell from 22% in 2000 to 15% in 2006 (7). With falling success rates, investigators need to submit more grants in order to remain funded–NSF estimates that an increase in proposal number of 30% from 2000 levels was needed to receive the same number of awards in 2006 (7). It is hard to find a good quantification of how much time researchers spend applying to grants instead of conducting research, but an Australian study estimated that each proposal took ~34 working days to write and cost the country ~ AU$66M in salary (8).
Bottom Line: The past decade has seen a drop in federal investment in scientific research, even though the economic return on investment is about $2 for every $1 spent in addition to the knowledge, technologies and treatments the research produces. Decreased funding has led to falling success rates for grants and uncertainty about the future for researchers. It is hard to predict the full effect of these cuts in terms of delayed medical advances or the loss of talented scientists.